How can I be sure of the data I use ?

My concept of a biodegradable object expressing someone’s energy consumption related to the web made me ask some important questions about statistics. Indeed, a lot of websites and articles give details about the energy used by a service. While looking for data concerning social networks, something became very clear (or unclear, you decide): how can I be sure the statistics are real ? I see a tweet equals 0.02gr of CO2. But what is 0.02 ? Does it include every parts of the system of posting a tweet (data storage, mobile data, server cooling etc.) or is it just the electricity ?

I contacted Frederic Bordage, expert in green IT and director or greenit.fr. His first answer was that I was right to believe that companies can make the numbers say what they want. For example, the 0.02gr of CO2 is a very abstract number. What does it represent ? How can I compare ? Frederic preferred to speak about it at the Innov’eco conference in 4 days. I will keep you informed.

Statistical Table I was working on. Each cell has a link to the source of the stat.

Statistical Table I was working on. Each cell has a link to the source of the stat.

Insight: biodegradable tangible interface

In the last post I explained that I had several ideas for my master’s project. I discussed it with one of my teacher. This is more related to the duality between art & information. This is linked to the concept of Ambient Display Technologies.

Concept #1

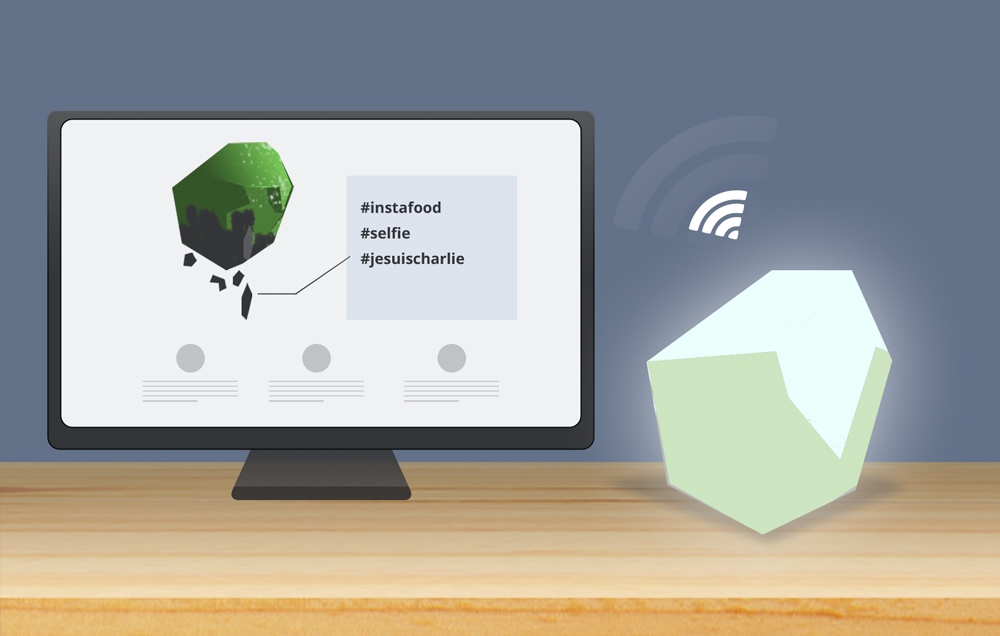
The concept: a website with a 3D object which is degraded by proportionally by tweet streams. The live tweet transmission can be perceived in a tangible way thanks to a real object created with organic materials which is also degraded. There are two aims in this project:

I think it may be a good way to make live tweet data-visualizations more useful. Here it will be a metaphor of the consumption and how a simple tweet, when retweeted 5billions times like #JeSuisCharlie can affect the planet. This isn’t just the electrical cost of a tweet, but this is about the whole system: don’t forget about the servers, datac enters, cooling system, screens displaying the information etc.

Of course this is still the beginning of the reflexion. Now that I have this intuition I’m gathering information to see if it’s a viable way to achieve my idea.


The writing of my dissertation & the ideation phase

My main research phase ended in December. A lot of videos, pictures, articles and books are now in my head and used as references for my dissertation. Today I just ended my first official version of the document. Of course it’s a raw version and the edition of the document will start during February. It’s a relief. But it’s just the beginning from now until the end of June.

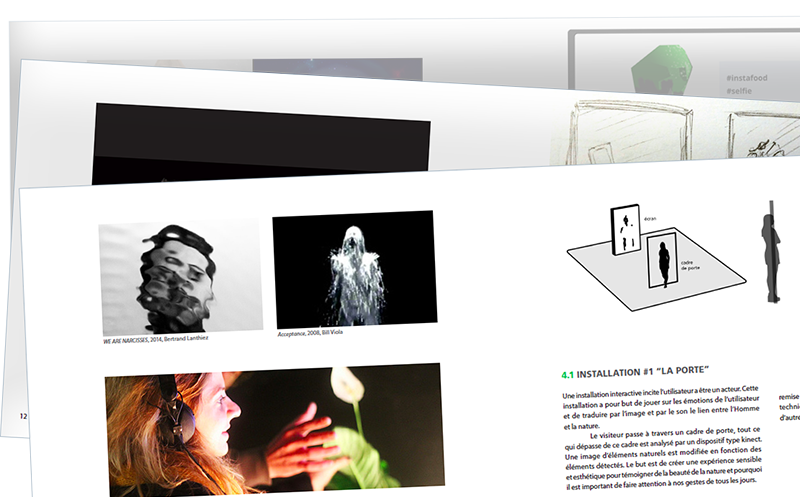
My ideation phase which started at the same time as the writing is now more tangible. I created a short document —I will publish the 26 pages soon on Slideshare— with six concepts I had:

  • 2 installations
  • 1 website
  • 1 website and it’s connected object
  • 1 concept of interactive storytelling
  • 1 concept of packaging-free market in partnership with the University of Darmstadt

The last one is still waiting for my school’s approval and I hope that I’ll have an answer at the end of the month. This is a first short at thinking at every possibilities to answer to key concepts of my research such as:

  • the tangible link between humans and nature is too thin
  • people don’t have basic informations about climate change and they developed bad habits and routines through the ages
  • there are ways to make the Internet more tangible
  • the way an information is delivered can change the way we perceive it

I think that I will take some more time to think about other possibilities and I’ll discuss it with my dissertation’s tutor and my professors. You can learn more about my planning for the next few months: