Writing and edition: done

Three weeks ago I finished writing of my dissertation. It took me 2 weeks for the editing. I was prepared thanks to the research paper I wrote last year about tangible interfaces.But, even so, it was the longest document I have ever written [or edited], for a total of 160 raw pages. I’ll support my dissertation next Tuesday. Even if I don’t have the results yet I think that I may be able to judge my own work.

I managed to stick to my timetable. I planned everything since December. I think that it was well timed since my research phase was efficient and I wasn’t stuck in articles and references to consult. It’s the danger when you become to enthusiastic about a subject you like. It’s more difficult when it’s a modern and debatable subject when theories and point of views vary every day. Now it’s time to prepare for my diploma’s project.

Visit of the exhibition: Musings on a Glass Box – Diller, Scofidio + Renfro

I have not been posting for almost 3 weeks. The reason is that I was finishing to write (or rewrite) some parts of my dissertation. It was sumbitted on friday. This is the raw version without graphic editing.

Today I felt exhausted. It feels good in a way because you feel like you have accomplished something that matters. I think I want my work to make me accomplish things for people. This is what I discovered while writing this dissertation…

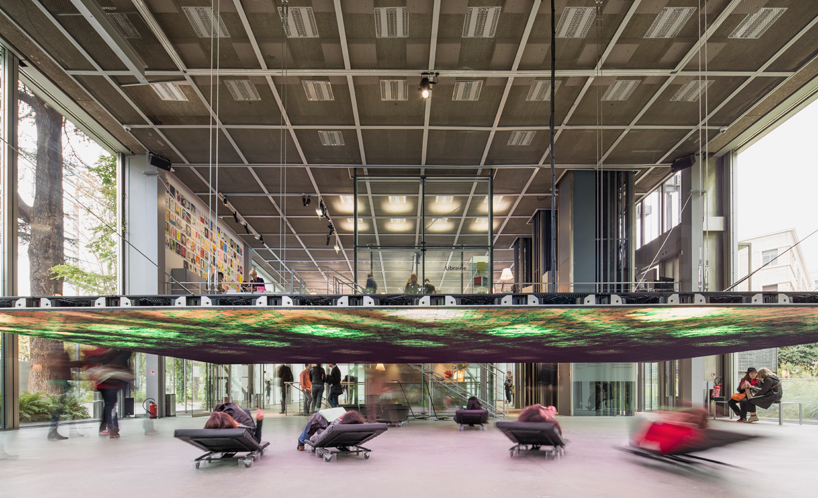
I needed to rest this is why I went to La Fondation Cartier pour l’Art Contemporain. It was my first time here. There is a lot of sunlight, everything feels warm. I went there to see the  Musings on a Glass Box installation. This is very poetic and it gives you time to rest. The installation is divided into two parts: while in the first room you can follow a bucket with water in it. It’s aim is to collect water drops from the roof. Inside the bucket, you find a camera. Everything is recorded. People in the other room are lying on a long chair with a screen above them. They see everything that’s recorded by the bucket. Each time a water drop falls it created sounds, it modifies the music and create abstract movements on the surface of the water. It deforms the video watched by visitors.

Picture I took while under the screen

Picture I took while under the screen

Considering social networks as consumption goods

My recent researches and discussions led me to think about considering the use of social networks as the use of consumption goods.

In economics, a good is a material that satisfies human wants and provides utility, for example, to a consumer making a purchase. A common distinction is made between 'goods' that are tangible property (also called goods) and services, which are non-physical.
— Alan V. Deardorff, 2006. Terms Of Trade: Glossary of International Economics, World Scientific. Online version: Deardorffs' Glossary of International Economics, "good" and "service".

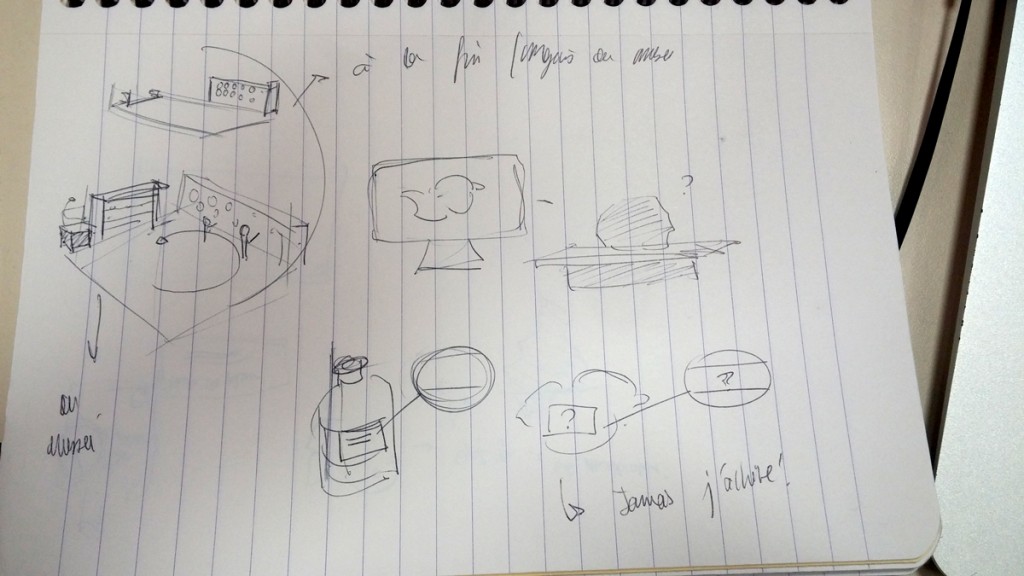
I think I should look at labels on products. What if there were labels to determine the energetic impact of a service on the Internet ? What if the user could scan a tangible representation of the service he’s using to get detailed informations on something he uses in his everyday life ?

It can be a service, or it can be an installation. I think the installation can be interesting and could be implemented in an ecologic store or packaging free shop.

Sketch

Sketch

How can I be sure of the data I use ?

My concept of a biodegradable object expressing someone’s energy consumption related to the web made me ask some important questions about statistics. Indeed, a lot of websites and articles give details about the energy used by a service. While looking for data concerning social networks, something became very clear (or unclear, you decide): how can I be sure the statistics are real ? I see a tweet equals 0.02gr of CO2. But what is 0.02 ? Does it include every parts of the system of posting a tweet (data storage, mobile data, server cooling etc.) or is it just the electricity ?

I contacted Frederic Bordage, expert in green IT and director or greenit.fr. His first answer was that I was right to believe that companies can make the numbers say what they want. For example, the 0.02gr of CO2 is a very abstract number. What does it represent ? How can I compare ? Frederic preferred to speak about it at the Innov’eco conference in 4 days. I will keep you informed.

Statistical Table I was working on. Each cell has a link to the source of the stat.

Statistical Table I was working on. Each cell has a link to the source of the stat.

Insight: biodegradable tangible interface

In the last post I explained that I had several ideas for my master’s project. I discussed it with one of my teacher. This is more related to the duality between art & information. This is linked to the concept of Ambient Display Technologies.

Concept #1

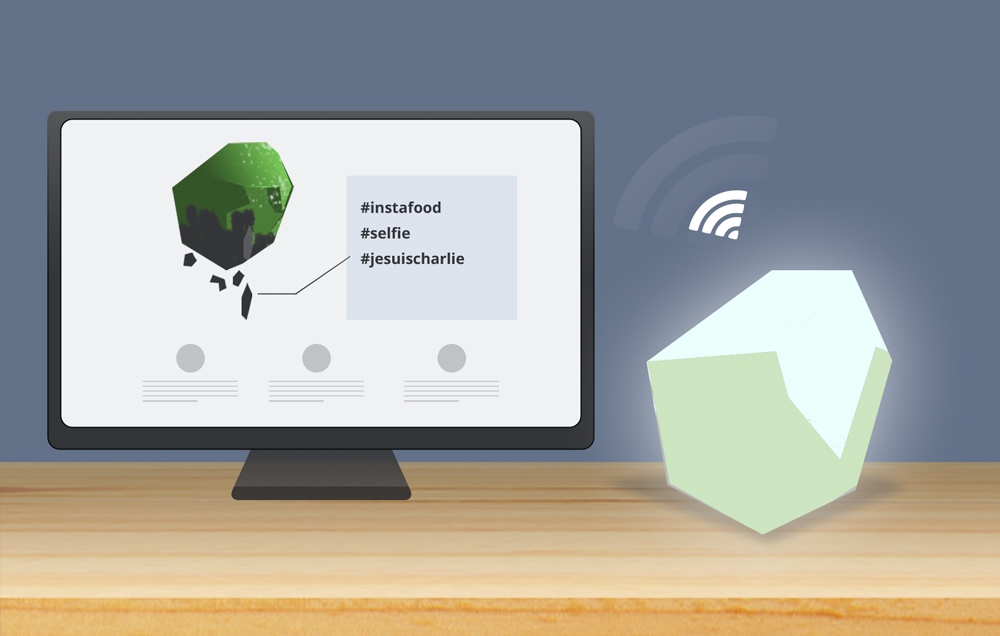
The concept: a website with a 3D object which is degraded by proportionally by tweet streams. The live tweet transmission can be perceived in a tangible way thanks to a real object created with organic materials which is also degraded. There are two aims in this project:

I think it may be a good way to make live tweet data-visualizations more useful. Here it will be a metaphor of the consumption and how a simple tweet, when retweeted 5billions times like #JeSuisCharlie can affect the planet. This isn’t just the electrical cost of a tweet, but this is about the whole system: don’t forget about the servers, datac enters, cooling system, screens displaying the information etc.

Of course this is still the beginning of the reflexion. Now that I have this intuition I’m gathering information to see if it’s a viable way to achieve my idea.