Questioning the physical form

Last week I went to La Paillasse. It’s a biohacking space created by Thomas Landrain. His team and him created a Bio Ink. “Imagine a pen that grows it’s own ink”. I talked to him about my project. He gave me an interesting feedback and told me to contact some fablabs as Usine.io and WOMA. I called Guillaume from WOMA and I have an appointment with him soon to pitch my project and explain how I would like it to be. I’m not a product nor an industrial designer. I know that some options I want to add to my connected phonecase would be tricky with hardware, so maybe there exist ways to do it differently.

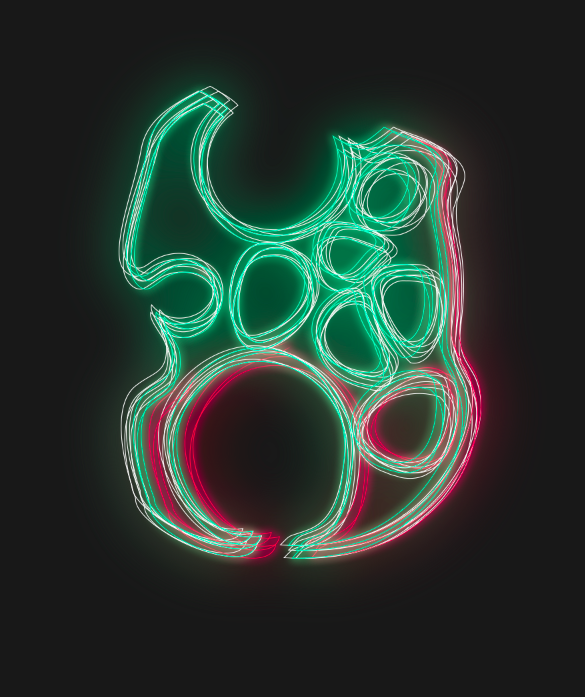
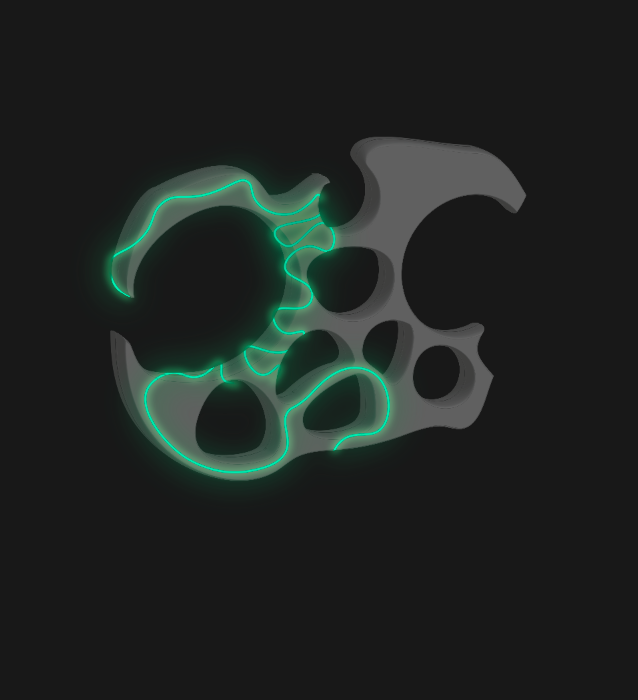
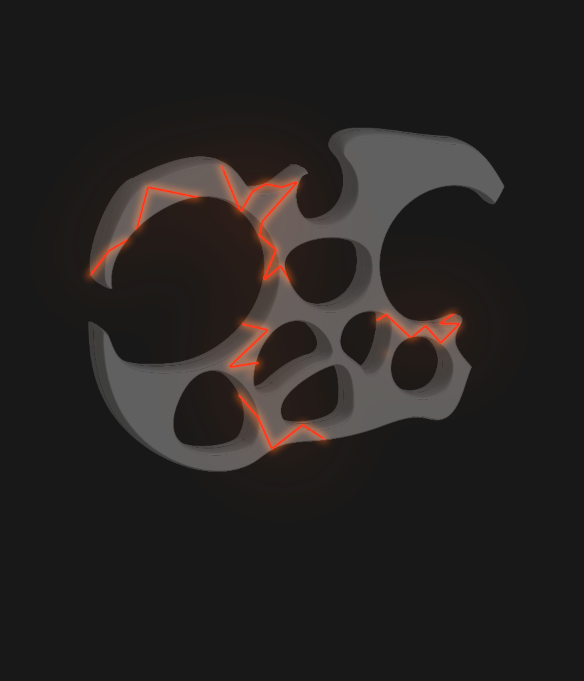
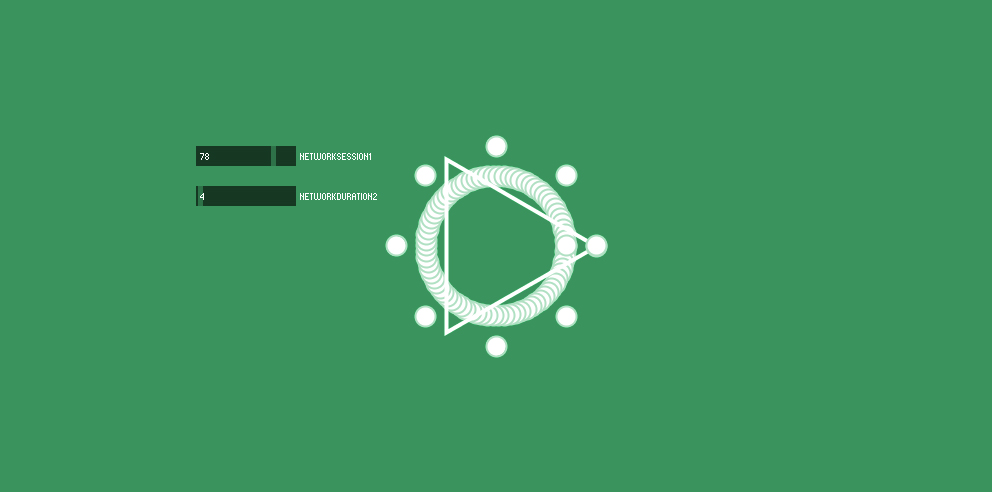
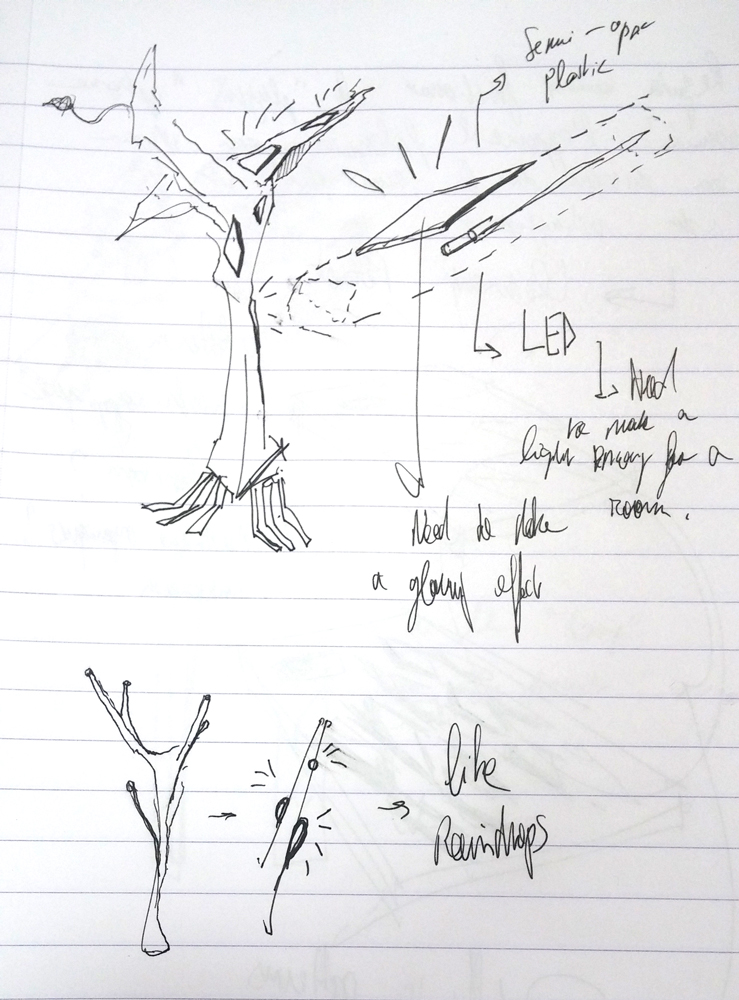
I just finished my keynote and some graphic prototypes. Recently, in the subway, I has the idea to add LED wires to the phone case like vine. There would be green, orange and red wires. I wanted to separate them because the way they are attached to the cellular-looking structure of the phone case could also be part of the graphic expression of the information. A vivid red light with sharp angles doesn’t provide the same information than a round angled curved line. I can also use animation if there are multiple little LEDs inside a thin tube.  I’ll let you know soon about it!

proto-wireproto-wire-green proto-wire-red

Creation of personas

My survey led me to gather the precious data of 80 people from 17 to 40 years old, mostly living in Paris and Lyon. I crossed it with statistics I found about social networks energy consumption, behaviors and daily use of social networks. It helped me to created personas.

My process:
  • Gather global data
  • Gather precise data on users
  • Look for patterns
  • Deducing main research fields, important for my design
  • Creating unique personas with different personalities, needs, expectations

I ended up creating 6 personas you can consult on the slideshare below? [A part is still in french and I will translate it soon]

Prototyping phase 1

I had a lot of work today. I’m beginning my prototyping phase. The aim is to test 3 different graphic representations of the efficiency index. I will select 9 persons divided into 3 groups. I’ll test their reaction to 3 types of visuals:

  • the first type focused on the shape
  • the second one, on the color
  • the third one, on the texture

I’ll gather informations thanks to a google form filled by the users. Then, I’ll generate the data visualization using cinema4D, processing, and photoshop. The cover of the article represents my first test with processing. It will evolve a little bit but I need to keep it really simple so users have a concrete representation and are not distracted by useless features.

Tomorrow, I also need to start gathering more statistics about data centers so Frederic can help me with the calculus of the efficiency index.

proto-1-c4da

Proto 1 – Cinema 4D

proto-1-c4db

Proto 1 – Cinema 4D