I had a lot of work today. I’m beginning my prototyping phase. The aim is to test 3 different graphic representations of the efficiency index. I will select 9 persons divided into 3 groups. I’ll test their reaction to 3 types of visuals:
- the first type focused on the shape
- the second one, on the color
- the third one, on the texture
I’ll gather informations thanks to a google form filled by the users. Then, I’ll generate the data visualization using cinema4D, processing, and photoshop. The cover of the article represents my first test with processing. It will evolve a little bit but I need to keep it really simple so users have a concrete representation and are not distracted by useless features.
Tomorrow, I also need to start gathering more statistics about data centers so Frederic can help me with the calculus of the efficiency index.

Proto 1 – Cinema 4D
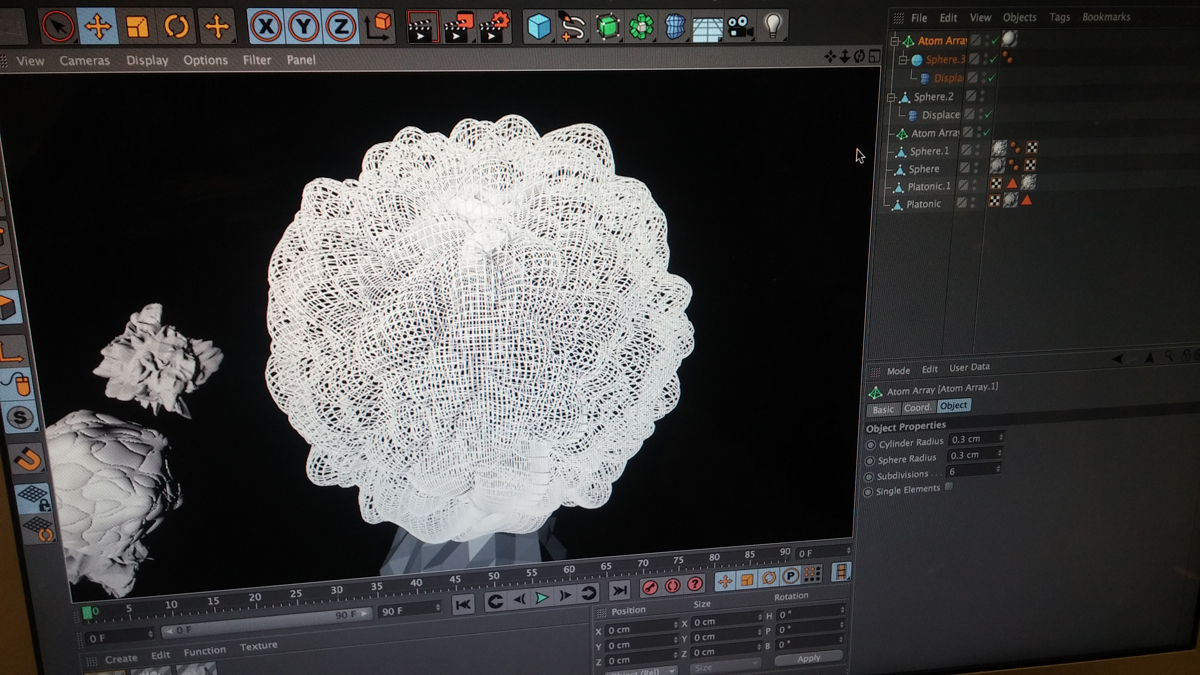
Proto 1 – Cinema 4D